
Get your free ebook


Google Analytics is probably the most popular analytics tool out there. It gives you a lot of details and even allows you to create your own tracking path.
These are the basic features of Google Analytics:
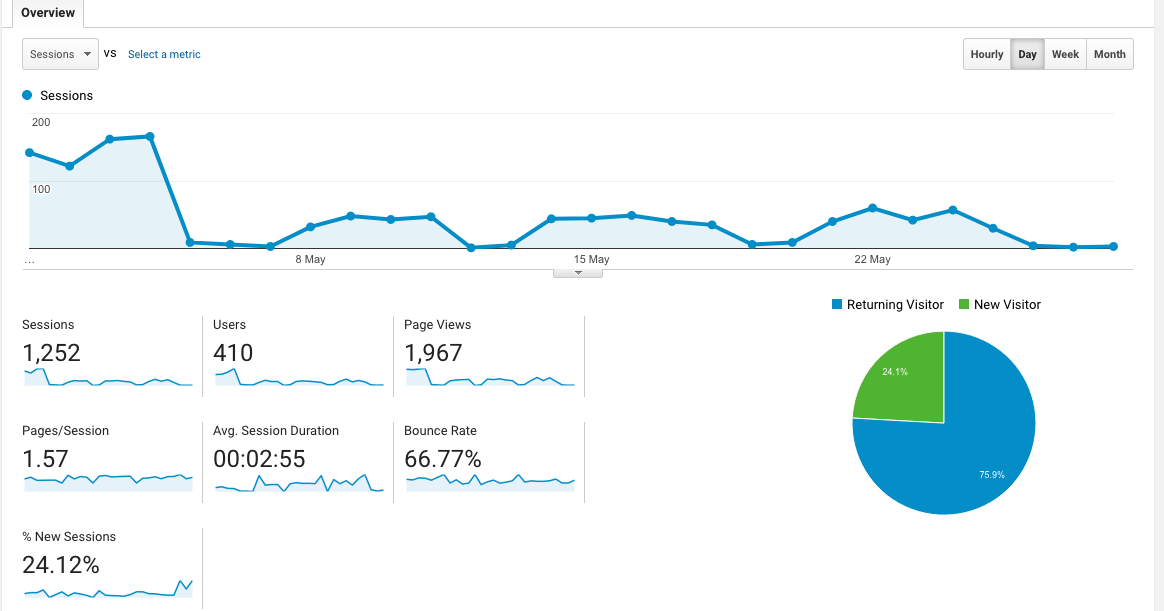
The crucial information you should always keep in mind are your application trends. They are the answers to such questions as:
It’s good to check these details quite often.
Also, be aware of your session duration. It varies greatly, depending on the kind of product you’re offering. Ask yourself:
”Are 4 minutes the right amount of time to buy a product and not get frustrated in the process? Maybe we should reduce this time somehow?”
Or maybe that’s not the problem at all. It could be that your authentication token isn’t long enough to maintain the session and your customers get angry because they need to log in a couple of times during the process.
No matter what you’re struggling with, your “Audience” can point you in the direction of new solutions.
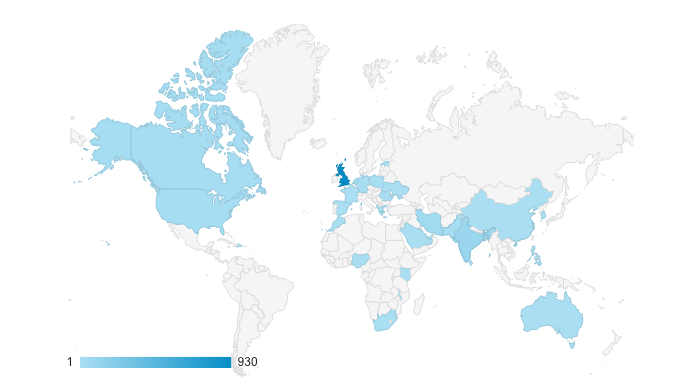
Do you know where your customers come from?
Are you sure you really got through to your target audience?
Maybe you should consider developing one more language version?
Or, from a totally different perspective, maybe it’s worth checking out whether someone is spamming you or trying to hack your application?
The questions never stop, but every bit of information helps you find more answers.
You already know how many customers you have, which is great. What you should do now is focus on differentiating between them and classify them accordingly. Are they new customers or returning ones?
Decide which of the two groups is more important to you at the moment. It may be time to create an onboarding process and think about offering benefits to the newcomers. Conversely, maybe the majority of your ROI comes from the clients who already know of your product and use it.
But that’s not all “Behavior” can do for you. It’s easy to go deeper and learn the number of customers per number of sessions or the time they spend on your website.
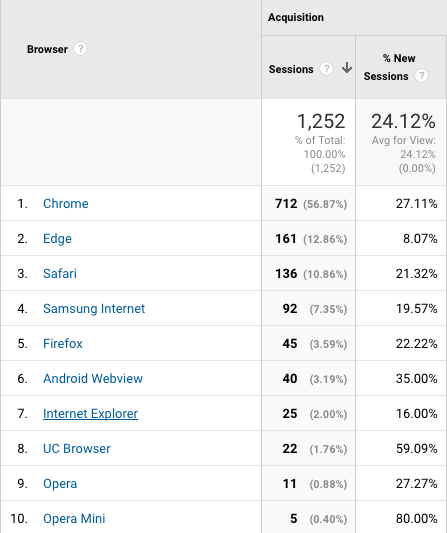
During testing, it’s good to know the browsers your customers use. This way, you’ll know which browser you should pay extra attention to.
You can even check a specific version of the browser that is of relevance to you, for instance in the process of trying to reproduce some bug.
Imagine you have constant problems with a certain version of a certain browser, but few of your customers actually use it. In that case, the smartest solution could be to add a disclaimer that your website doesn’t support that browser, and you recommend using a different one.
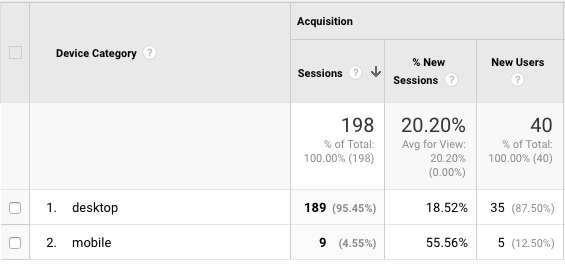
Mobile-first and mobile-only are both options worth keeping in mind.
It’s important to ensure your web application also looks good on mobile devices. However, don’t forget to check mobile traffic while developing new features. This data will make it easier for you to decide how much time and money you’re willing to spend on good mobile design.
You can be even more thorough and check specific devices your customers use, to be certain the application works well on them. Such due diligence always pays off.
If you notice the mobile traffic is greater than 50% for some parts of your application, it’s definitely worth putting your focus there. The highest mobile traffic tends to be visible on one of the first pages of your app and the registration process.
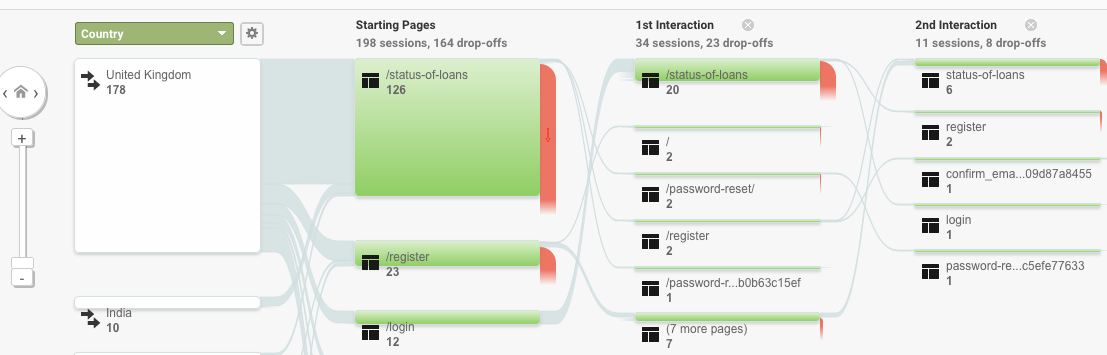
Wouldn’t you like to know the journey your clients take through your application?
If so, “User flow” is the tab for you.
“User flow” serves two main functions:
The former helps you decide where to put ads, while the latter sets your priorities right (or at least it should).
Then there’s the “Site content” tab. The tab makes it easier for you to track the most popular pages and subpages in your application.
For any specific ads, onboarding processes, or ideas about maintaining user engagement with your service, you should also check the “Landing pages” and “Exit pages” tabs.
If these tabs show you that a page of great importance to you is practically invisible or very difficult to reach for your clients, consider moving it someplace else or adding some links to it on the more popular pages.
Traffic is very important in all potential marketing campaigns for your product. Before launching a campaign, research the parts of the internet your customers come from.
Is it organic search, referrals, or a different source?
If you already have some ongoing campaigns, you can also check how much of your traffic is driven by paid search. Additionally, you can get more details about the sources of your traffic.
Site loading speed is instrumental for your users. If your site takes too long to load, the clients may think the page doesn’t work, leave, and never come back. You don’t want that, do you?
Thought so. To stop that from happening, check the load time and discuss what you could do to speed up your website with your team.
You can also check the site speed per browser to learn the exact number of your customers who may be experiencing delays.
Google Analytics also allows you to check real-time traffic details.
It’s fascinating to see your users come and go through your website as the time passes. Observing this makes you realize your site is very much alive.
What we’ve covered above comprises only the basic stats you can find in Google Analytics without any additional actions or implementation.
Naturally, GA offers you a lot more: experiments to plan, goals to set, campaigns and adwords to track.
You can also use it to analyze your audience in a more detailed way: by age, gender, or interests.
Google Analytics is quite easy to implement—you just need to insert a special code into your website to track all the traffic.
Also, don’t forget to cut your testing/sandbox environment to make sure the details you see in GA were generated by real customers and not by you checking new features. It’s good to use Google Tag Manager for that purpose while implementing GA, then switch on the GA via GTM.
With GTM, you will get simple access to other Google tools that may help you develop your product further.
Once you have all the information from quantitative research, you might be interested in a more in-depth analysis of how your clients behave and how you can improve their experience with your product.
Hotjar can help you do that. It’s a really great supplement to your Google Analytics data.
Below you’ll find the main features of Hotjar.
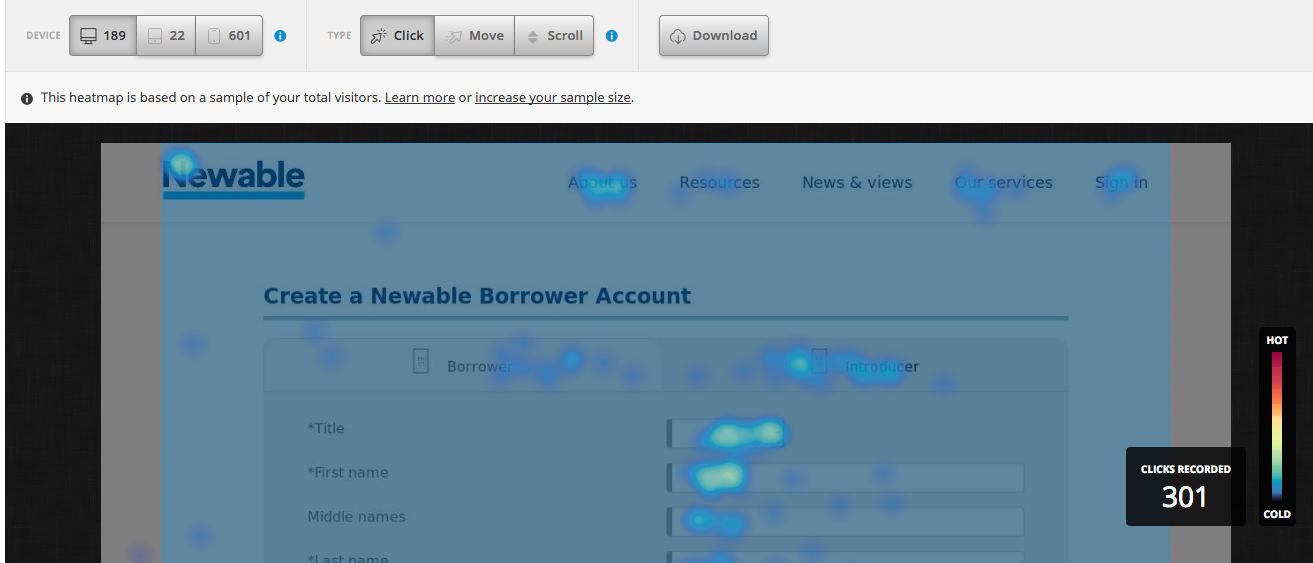
Heatmaps are a good place to connect both quantitative and qualitative details.
At the top of the page, you can see how many users in total have visited your site and what kind of devices they’ve used to do it. More importantly, you see all the places where your clients click, move the mouse, or scroll the page.
This information can be hugely helpful in choosing ad placements or new features you want to be the most visible to visitors. It also gives you a clear picture of which spots and links seem important and interesting to your audience, and which of those may very well be unnecessary.
Try reshuffling where you put what and why. If you rearrange some of your services or options, you give your users an opportunity to make new choices between them. This, in turn, helps you decide what you should develop more.
It’s also worth checking how far down the website your users scroll. It’s usually relatively easy to pinpoint “dead” areas where there is little to no activity on their part.
This shows you where you shouldn’t put any information of importance, or move it up. However, if you want your visitors to interact with such an area, it might be a good idea to implement some feature that would direct them there.
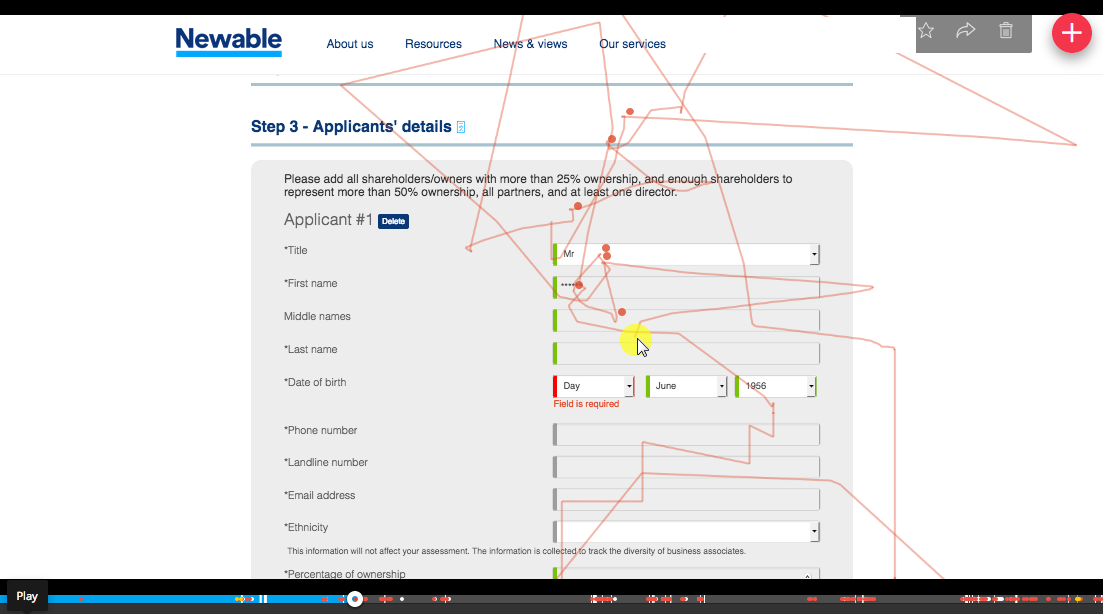
Recordings are the best way to track just how your customers behave on given pages.
You can clearly see all the places where your clients are struggling. Whether it’s eliminating problems or general debugging, watching these recordings is a great indicator of where you should start and which issues to prioritize.
It’s also useful to watch the entire recordings, instead of just paying attention to the clicks. Naturally, the clicks are very important, but no less so than all the movements.
If your application relies on information your users need to check elsewhere, it’s easy to notice the exact moment they switch to another window or turn to physical documents. That moment is very important—make a note of where they leave the cursor, as that may well be the perfect place for ads.
Also, don’t forget to check the mean time of filling out the application. It may be a key piece of information once you’re setting the time for the authorization token to expire.
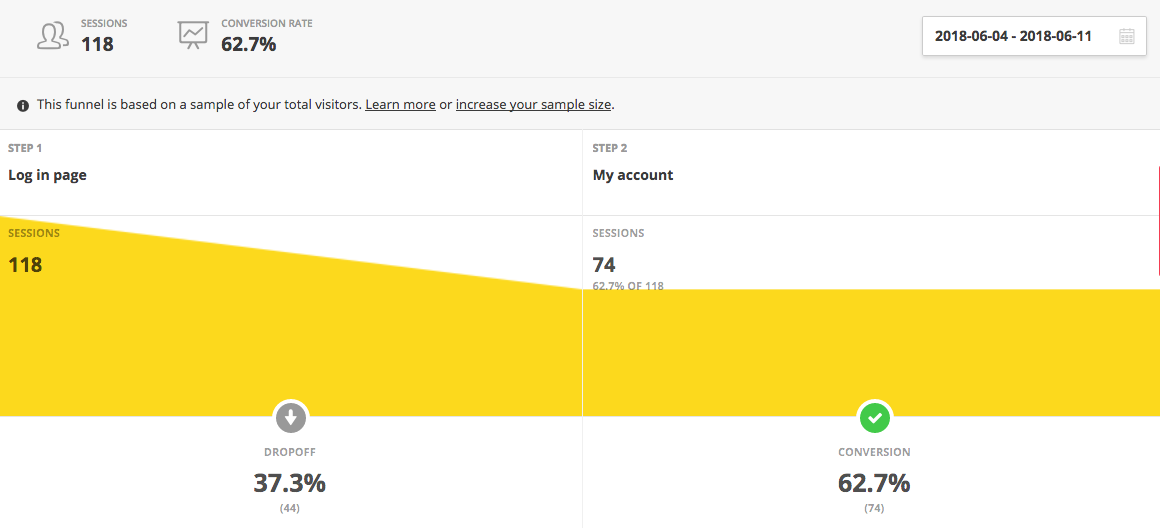
You can easily set up funnels yourself. Their purpose is to check the stages of the process where you lose clients.
What’s important is how many steps the process has on given pages. Checking where the drop is the largest will help you choose the stage of the process you should focus on improving first.
Remember that process complexity may not be the only blocker for your visitors. Their understanding aside, you may also be dealing with a bug that prevents your clients from proceeding.
Hotjar also provides several tools that help you collect feedback from your customers.
However, gathering qualitative data is a topic for a whole separate article. I’m just mentioning it here as an example of many, many more features Hotjar has to offer.
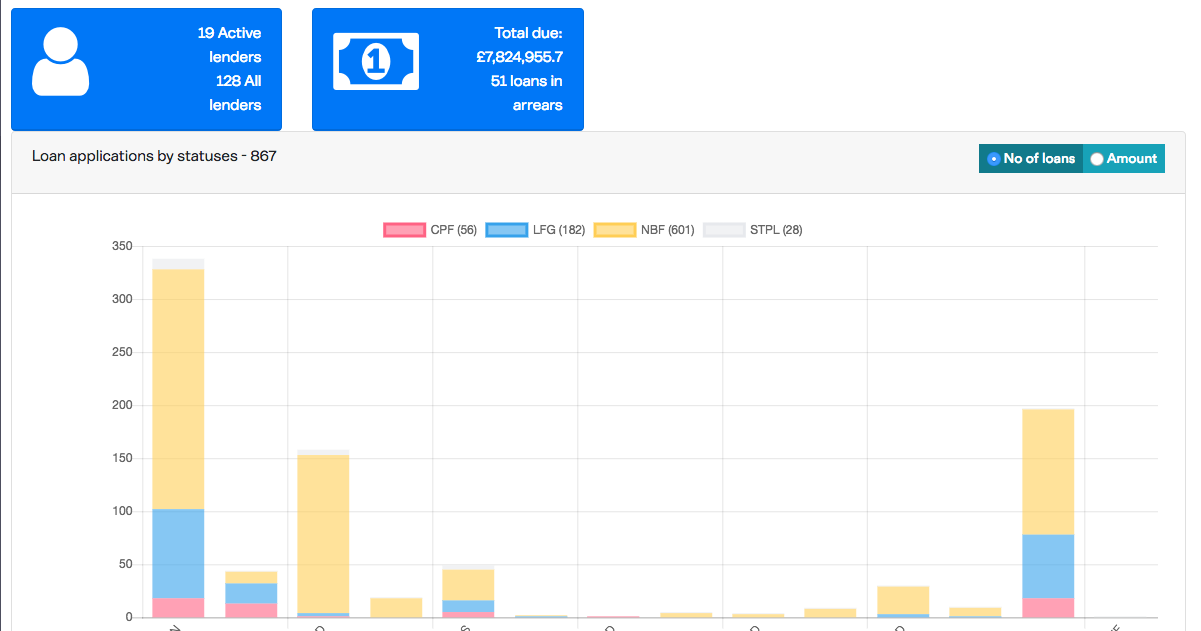
Remember to create your own dashboards when using external tools to gather the most important analytical data for your company. The overall number of your customers, page views, etc. are all hugely informative, but there may also be certain data specific to your business that you need to control.
For example, if the purpose of your application is to help clients get a loan for their business, then you should know how many clients applied for the loan, and how many loans you disbursed. This will help you learn the obstacles your future users may stumble upon between applying and getting the money.
You can put all the necessary information on your own dashboards and use it when making decisions about developing the project. If you want to connect Slack with your application to list some of the most relevant data, you can do that, too.
The statistics regarding the work of your team may also have a significant influence on your work. This could mean a whole bunch of things—from team velocity to work predictability—but it’s another massive topic that deserves its own separate article.
Here’s the most important thing about product analytics tools: don’t treat them as a “nice-to-have,” but rather as a “must-have.”
Without analytics, there’s simply no way you’ll be able to have enough data to make good decisions, set reasonable goals, and choose the right directions.
At the very least start with Google Analytics to get an idea of the traffic on your website. A basic understanding of the way users interact with your site is enough to start making informed decisions and plan ahead. Visitors means traffic, and traffic means money.
Hotjar is also very helpful, but you can put implementing on it the backburner for a while, if you don’t have enough time to use it from the get-go. Just don’t wait too long to start using it, since it’ll also bring you a lot of valuable information.
Trust me when I tell you that it really is no effort at all to get started with Google Analytics and Hotjar. You only need to set them up on your site and add a couple of lines of code to your app. The rest will follow, and the return on that small investment will be invaluable.
I’m pretty sure I’ve said this already, but I’ll repeat it just in case, to leave you on a practical note: don’t forget to check if you’re only collecting data from live environment, from your real customers. If this data gets mixed up with the test data, you won’t be able to make any actionable predictions.
Thanks a lot for reading my article! If you have any questions, leave a comment in the section below and I promise I’ll get back to you.
For more updates from STX Next, use the neat box on the right (or below, if you’re on mobile) to subscribe to our newsletter. And if you’d like to learn more about the kind of services we offer, look no further than here.